Sample size in A/B testing – how to calculate it correctly

Statistical Tailwind - Sample Sizes in A/B Testing
A/B tests help with comparing two variations of a specific component. The goal is to find the variant that leads to more interaction with the customer. For example, different advertising banners can be compared to maximize the click-through rate or different web pages can be compared with the aim of keeping customers on the website longer. It is also common to use A/B testing for emails. It can be interesting to see if a different subject line leads to a higher open rate or if a differently designed content leads to a higher click-through rate.
The procedure is similar in all cases:
First, (at least) two versions of the object to be tested are created.
Then, two separate test groups, which are part of the population, are confronted with variant A or variant B
Statistical tests then show which of the variants has a greater impact on the target variable.
The "winner" variant will be shown to all subsequent visitors. In emails, all remaining subscribers who do not belong to any of the test groups will receive the winner email.
The problem of the missing foundation
The reactions of the members of the (test) groups are tried to be generalized. In statistics, these groups are called "Samples". If the results can actually be generalized, it is said that they "representative" for all individuals - so they apply to the entire population. When looking at the validity of test results through the lens of statistics, one often unfortunately realizes that the decision made was more of a guessing game and not reliable.
To obtain a representative, statistically significant result, the number of test subjects is crucial, which is often underestimated. Therefore, the crucial question is: What should be the size of my sample per variant in order to confidently determine a winner?
Instead of racking our brains over complex formulas, we can conveniently rely on simple online calculators, which we will discuss further below. However, in order to understand them, a few statistical terms are still needed.
Four statistical terms for your successful tests
The sample size depends on four variables: the expected conversion rate, the minimum effect size, the test power, and the significance level.
The Expected conversion rate (Baseline conversion rate) refers to the percentage of visitors or customers who perform a desired action. For example, if we send out 1000 emails and 300 emails are opened, the conversion rate for opening the email is 30%. This variable is estimated based on experiences and expectations.
The minimal effect size The term "Minimum Detectable Effect" indicates by how much percentage the variant would need to be better or worse in order for the test to be considered statistically significant. The rule of thumb is: the smaller the minimum effect size, the larger the sample size. This variable can and should be adjusted depending on capacity. It can be expressed either in absolute terms or in relative percentages.
The probability of detecting a significant difference when none exists is called significance level. Typically, a value of 5% is used.
The statistical power defines the probability of detecting an existing difference between the variants. The standard is typically set at 80%. Both the probability of error and the test power should ideally not be significantly altered.
Calculating the sample size
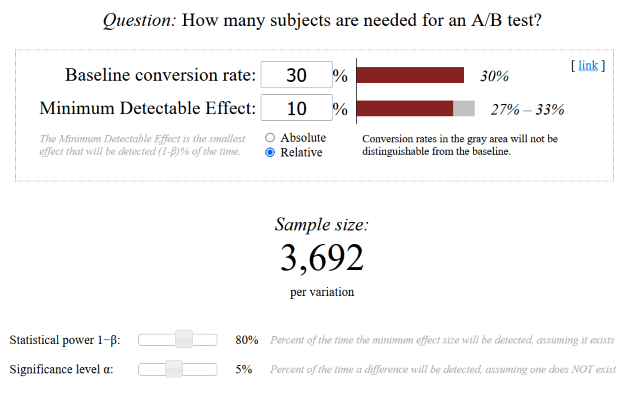
As already announced, we will use convenient online tools. One recommended calculator is the one from Evan Miller. Here we find the four variables again and can simply insert them. The calculator will then give us the quantity of required impressions per variant In order for our A/B test to produce a statistically significant winner.
Example of application: We want to optimize the subject line of our email newsletter, which has achieved an average open rate of 30% so far. Therefore, we set the baseline conversion rate at 30%. Our new subject line should be at least 10% better in order for us to prefer it over the current one. Therefore, the Minimum Detectable Effect is 10% relative. With unchanged test power and error probability, we conclude that we need to test the new subject line on 3692 contacts for our test result to be statistically significant.
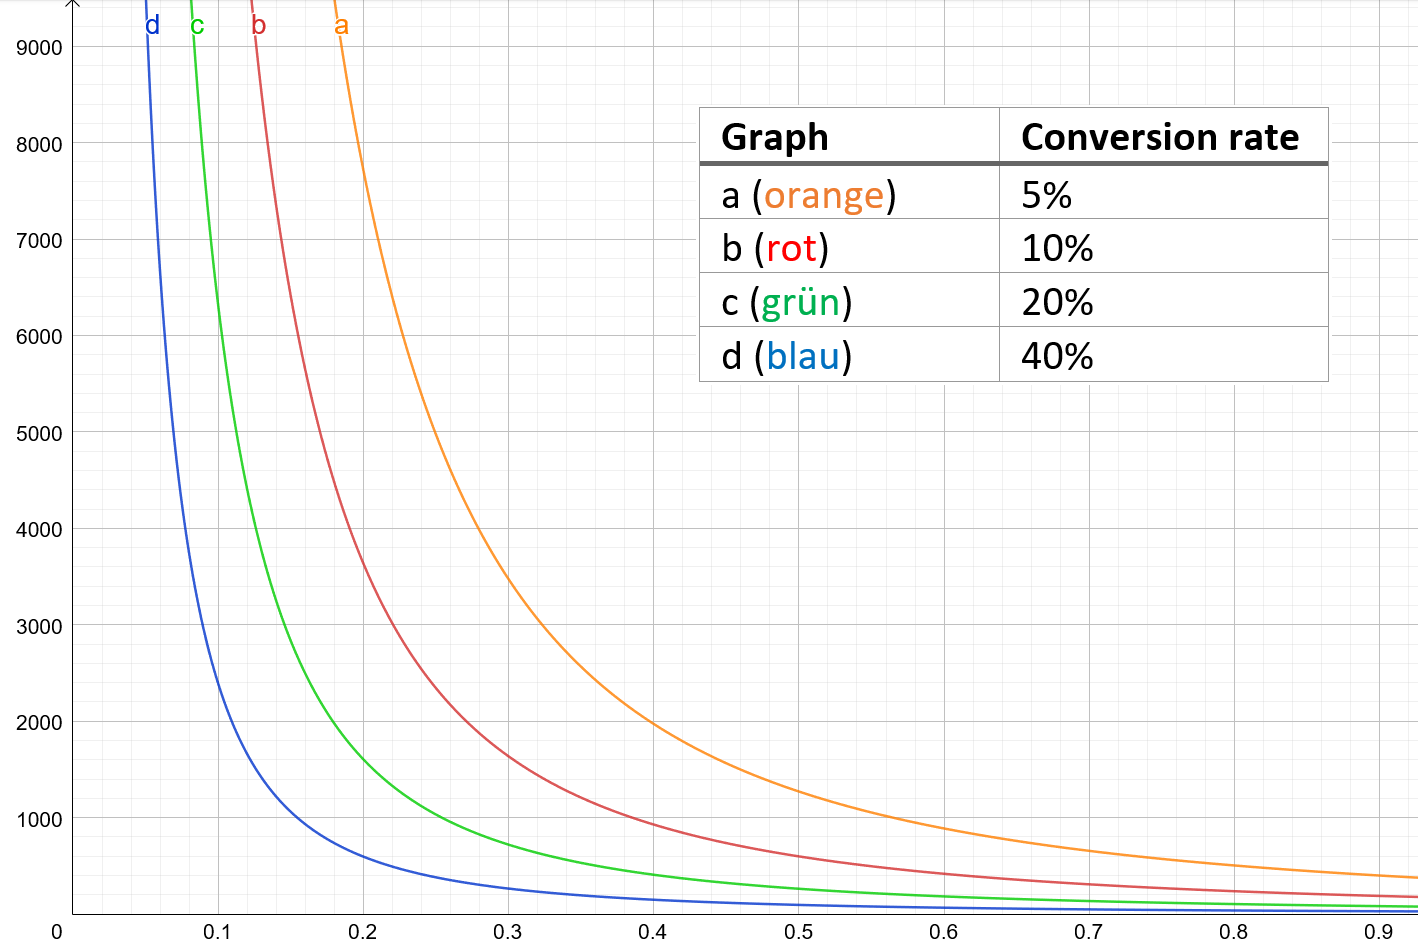
To get a sense of the magnitudes and relationships, we can look at the graphs.
The different graphs represent different conversion rates. On the x-axis, we find the minimum relative effect size and can therefore read the sample size per variant on the y-axis. The statistical power is 80%, the significance level is 5%.
Example of application: With a conversion rate of 20% and a minimum relative effect size of 10%, we can read a sample size of just over 6000. Specifically, it is 6347 contacts.
Hints and difficulties
As with all statistical tests, there are factors that externally influence our results and could potentially distort them. These could be seasonal fluctuations, breaks and vacation times, or even the behavior of competitors. It is important to assess these external factors and take them into account.
Despite the theoretical background of sample size in A/B tests, in practice A/B tests can be conducted even if they are not statistically significant, because: Weak data is still better than no data at all.
Share this post